Key terms
Spreadsheet and sheets
Spreadsheet: A document that a user works with in MyOffice Spreadsheet.
Sheet: A section of a document that has a table structure. You can switch between sheets using tabs. Each sheet has a unique name, which is displayed on its corresponding tab.
For a detailed description of working with sheets, please refer to the Sheets section.
Column and row
Columns: Vertically arranged groups of cells on a sheet.
Rows: Horizontally arranged groups of cells on a sheet.
Rows or columns to repeat: Rows or columns that are displayed on every page when printing a table or exporting a document to PDF. They are used as headers.
For a detailed description of working with columns and rows, please refer to the Cells, columns, and rows section.
Cell
Cell: A data field in the intersection of a row and a column.
Active cell: A spreadsheet cell that is currently selected and being edited. The active cell is always framed.
For a detailed description of working with cells, please refer to the Cells, columns, and rows section.
Range of cells: A group of cells on a worksheet that have been selected. Cells in a range can either be adjacent to each other (contiguous cells) or set apart from each other.
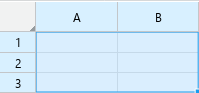
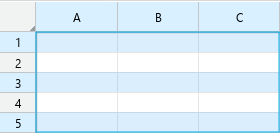
Regular range: A range with the same number of cells in columns and rows.
Examples of regular ranges:
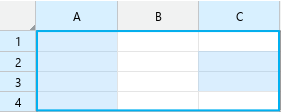
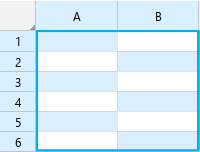
Irregular range: A range with different numbers of cells in columns and/or rows.
Examples of irregular ranges:
Data region: A rectangular range of cells containing data, bounded by empty columns, rows, and the workspace.
Filtering and sorting
Autofilter: The filter used by default when selecting a filter by condition. Limits the filter conditions based on the cell types in the column. Allows filtering by only one condition.
Advanced or Custom filter: A filter that, unlike an autofilter, does not limit the filter conditions based on the number of cells of a certain type in a column, but suggests filter conditions for all cell types. Allows you to filter by one or two conditions at once, as well as combine conditions using AND or OR operators.
Range of filtering: A user-defined range to which filtering and sorting can be applied. The range of filtering is highlighted with a green frame and contains filter buttons in the column headers. When filters are applied, the range of filtering becomes the filtered range.
Filtered range: The range of filtering for which filters are applied.
Formulas and functions
Formula: Any expression in a cell that starts with an “=” sign. Formulas can contain functions, values, cell addresses, names, and operators. Formulas are used to conduct complex calculations in spreadsheets. You can enter and edit formulas in the active cell, in the Formula bar, or in the Function wizard window.
Function: A preset formula in MyOffice Spreadsheet.
Simple formula: A formula containing a single function.
Complex formula: A formula containing a function as an argument, or a formula consisting of several functions linked by operands.
Nested function: A function that is an argument to another function or formula.
Array: A data structure consisting of one or more values that is treated as a single object.
Array formula: A special type of formula that allows you to perform multiple calculations on ranges of data simultaneously. Unlike regular formulas, array formulas work with all values in the specified ranges at once.
Cache: The latest calculated values of cells with formulas.
With the help of functions and formulas, you can perform calculations of any complexity. For a detailed description of working with formulas and functions, please refer to Formulas and Functions section.
Operands: The elements over which calculations are performed. MySpreadsheet uses the following operands:
–Constants: Numbers, dates, and text strings that are present directly in the formula.
–References: Elements that specify the cell or cell range from which the formula retrieves data for calculations.
–Functions.
Operators
Operators define the actions that are performed on operands during calculations.
Operators are a sign or a combination of signs. For example, “+” is an arithmetic addition operator. Also, operators may not be present in the formula.
For more information, please refer to Calculation operators section.
Chart area: Placeholder that includes all the elements of the chart.
Plot area: Part of the chart area where the data series are located.
Data series: Row or column of values that are contained on the document sheet and are used in the plotting of the chart.
Gridlines: Horizontal and vertical lines that help you visually orient yourself on the chart. They create a grid that intersects the axes and makes it easier to read and interpret the data.
Legend: Chart element that contains information about which colors, symbols, or lines correspond to different categories or data series.
Data labels: A chart element containing information about the values of data series or individual data points.
Range borders: Parameters that define the starting and ending points of the scale on the vertical axis. The minimum determines the lowest value displayed on the axis, and the maximum determines the highest value.
Interval between marks: The distance or step between marks on the vertical axis of the chart.
Main interval between divisions: The large divisions on the vertical axis, on which the numerical values and major gridlines are located.
Intermediate interval between divisions: The divisions that are located between the main ones, on which minor gridlines are located.
Display units: Shows the difference between the values of the quantity corresponding to two adjacent axis marks. If a division value is set for the axis, the values of the axis divisions are displayed taking into account the division value.