Change chart data source
You can change the data range used as the source data for you chart.The chart will be updated accordingly based on the new data range.
To change a range, perform the following actions:
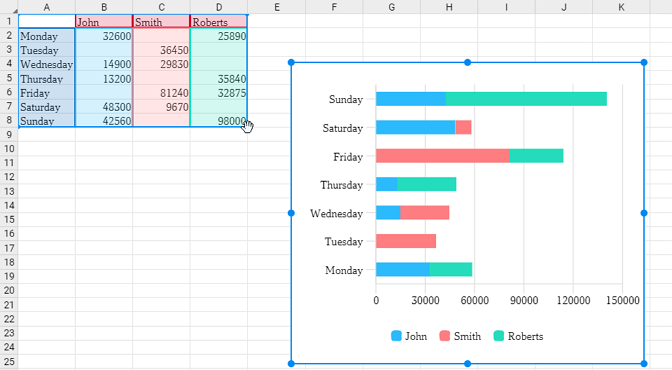
1.Select the chart you want to change the source range of.
2.Move the corner handle to change the chart range while holding the left mouse button pressed.
3.Release the left mouse button to fix the new range.
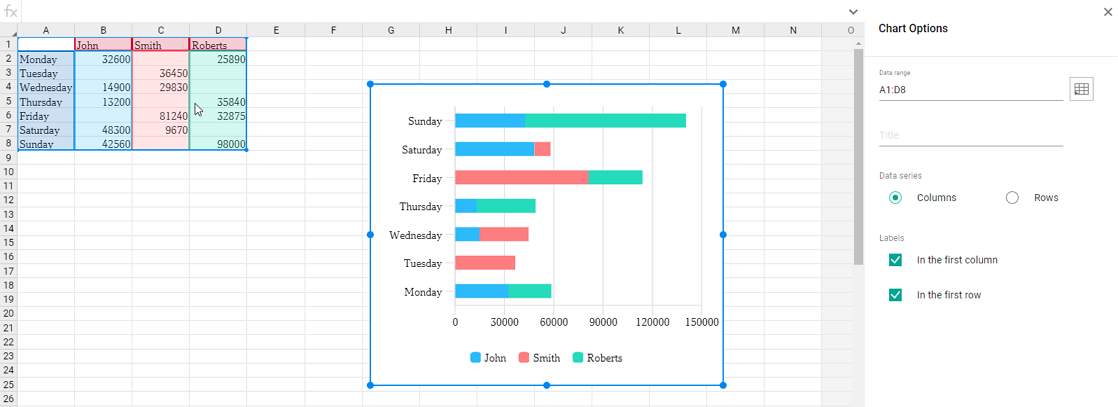
You can also change the range of the chart by using the Chart options button:
1.Select the chart you want to change the range of.
2.Select the Chart options commands:
•Use the Toolbar of the Chart contextual tab.
•In the Format menu, select Chart.
•Right-click to open the context menu.
3.Press  in the window that opens on the Sidebar.
4.Select the new range which will be used for the chart.